library('tidyverse')
library('summarytools')gglimpse or tibblet, tlimpse or dfsum
R
All in all, I like the summarytools package – however – I don’t like its heavy dependencies. Here, I want to create a lightweight alternative!
mm <- mtcars |>
  mutate(model_name = row.names(mtcars), .before = 1)
dfSummary(mm, style = 'grid', plain.ascii = FALSE, tmp.img.dir = 'plots')
temporary images written to '/Users/seb/Documents/Projects/00_websites/sbloggel/posts/2024-09-30-gglimpse/plots'Data Frame Summary
mm
Dimensions: 32 x 12
Duplicates: 0
| No | Variable | Stats / Values | Freqs (% of Valid) | Graph | Valid | Missing |
|---|---|---|---|---|---|---|
| 1 | model_name [character] |
1. AMC Javelin 2. Cadillac Fleetwood 3. Camaro Z28 4. Chrysler Imperial 5. Datsun 710 6. Dodge Challenger 7. Duster 360 8. Ferrari Dino 9. Fiat 128 10. Fiat X1-9 [ 22 others ] |
1 ( 3.1%) 1 ( 3.1%) 1 ( 3.1%) 1 ( 3.1%) 1 ( 3.1%) 1 ( 3.1%) 1 ( 3.1%) 1 ( 3.1%) 1 ( 3.1%) 1 ( 3.1%) 22 (68.8%) |
 |
32 (100.0%) |
0 (0.0%) |
| 2 | mpg [numeric] |
Mean (sd) : 20.1 (6) min < med < max: 10.4 < 19.2 < 33.9 IQR (CV) : 7.4 (0.3) |
25 distinct values | 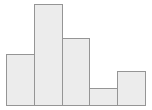 |
32 (100.0%) |
0 (0.0%) |
| 3 | cyl [numeric] |
Mean (sd) : 6.2 (1.8) min < med < max: 4 < 6 < 8 IQR (CV) : 4 (0.3) |
4 : 11 (34.4%) 6 : 7 (21.9%) 8 : 14 (43.8%) |
 |
32 (100.0%) |
0 (0.0%) |
| 4 | disp [numeric] |
Mean (sd) : 230.7 (123.9) min < med < max: 71.1 < 196.3 < 472 IQR (CV) : 205.2 (0.5) |
27 distinct values | 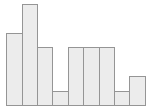 |
32 (100.0%) |
0 (0.0%) |
| 5 | hp [numeric] |
Mean (sd) : 146.7 (68.6) min < med < max: 52 < 123 < 335 IQR (CV) : 83.5 (0.5) |
22 distinct values | 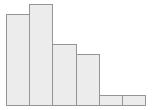 |
32 (100.0%) |
0 (0.0%) |
| 6 | drat [numeric] |
Mean (sd) : 3.6 (0.5) min < med < max: 2.8 < 3.7 < 4.9 IQR (CV) : 0.8 (0.1) |
22 distinct values | 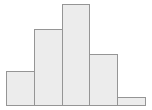 |
32 (100.0%) |
0 (0.0%) |
| 7 | wt [numeric] |
Mean (sd) : 3.2 (1) min < med < max: 1.5 < 3.3 < 5.4 IQR (CV) : 1 (0.3) |
29 distinct values | 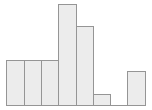 |
32 (100.0%) |
0 (0.0%) |
| 8 | qsec [numeric] |
Mean (sd) : 17.8 (1.8) min < med < max: 14.5 < 17.7 < 22.9 IQR (CV) : 2 (0.1) |
30 distinct values | 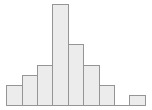 |
32 (100.0%) |
0 (0.0%) |
| 9 | vs [numeric] |
Min : 0 Mean : 0.4 Max : 1 |
0 : 18 (56.2%) 1 : 14 (43.8%) |
 |
32 (100.0%) |
0 (0.0%) |
| 10 | am [numeric] |
Min : 0 Mean : 0.4 Max : 1 |
0 : 19 (59.4%) 1 : 13 (40.6%) |
 |
32 (100.0%) |
0 (0.0%) |
| 11 | gear [numeric] |
Mean (sd) : 3.7 (0.7) min < med < max: 3 < 4 < 5 IQR (CV) : 1 (0.2) |
3 : 15 (46.9%) 4 : 12 (37.5%) 5 : 5 (15.6%) |
 |
32 (100.0%) |
0 (0.0%) |
| 12 | carb [numeric] |
Mean (sd) : 2.8 (1.6) min < med < max: 1 < 2 < 8 IQR (CV) : 2 (0.6) |
1 : 7 (21.9%) 2 : 10 (31.2%) 3 : 3 ( 9.4%) 4 : 10 (31.2%) 6 : 1 ( 3.1%) 8 : 1 ( 3.1%) |
 |
32 (100.0%) |
0 (0.0%) |