import pandas as pd
import plotnine as p9
import numpy as np
from scipy.integrate import odeint
from plotnine import ggplot, aes, geom_point, geom_line, facet_wrap
p9.theme_set(p9.theme_bw())

def dict_to_tuple(x):
return tuple(x.values())Elena’s paper
Python
Elena’s paper
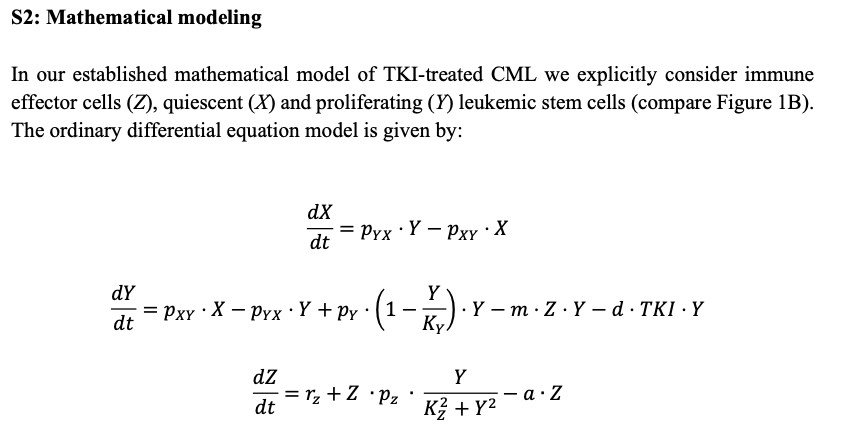
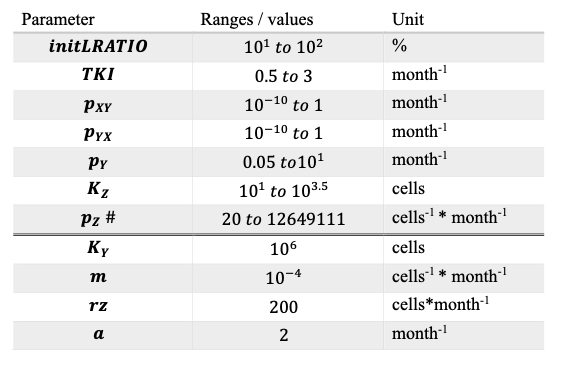
Started to play with Elena’s paper: Link to the paper
def get_p_and_y0(df, d = 1, i = 1):
    pp = df.iloc[i].to_dict()
    p = {key: pp[key] for key in ['Pz', 'Pyx', 'Pxy', 'TKI', 'Kz', 'Ky', 'Py', 'm', 'rz', 'a']}
    p['d'] = d
    y_0 = {key: pp[key] for key in ['X(0)', 'Y(0)', 'Z(0)']}
    return p, y_0


params_df = pd.read_csv('ParameterSets.csv')

p, y0 = get_p_and_y0(params_df, 1)
params_df
--------------------------------------------------------------------------- FileNotFoundError Traceback (most recent call last) Cell In[2], line 9 5 y_0 = {key: pp[key] for key in ['X(0)', 'Y(0)', 'Z(0)']} 6 return p, y_0 ----> 9 params_df = pd.read_csv('ParameterSets.csv') 11 p, y0 = get_p_and_y0(params_df, 1) 12 params_df File ~/Library/r-miniconda-arm64/envs/sbloggel/lib/python3.11/site-packages/pandas/io/parsers/readers.py:912, in read_csv(filepath_or_buffer, sep, delimiter, header, names, index_col, usecols, dtype, engine, converters, true_values, false_values, skipinitialspace, skiprows, skipfooter, nrows, na_values, keep_default_na, na_filter, verbose, skip_blank_lines, parse_dates, infer_datetime_format, keep_date_col, date_parser, date_format, dayfirst, cache_dates, iterator, chunksize, compression, thousands, decimal, lineterminator, quotechar, quoting, doublequote, escapechar, comment, encoding, encoding_errors, dialect, on_bad_lines, delim_whitespace, low_memory, memory_map, float_precision, storage_options, dtype_backend) 899 kwds_defaults = _refine_defaults_read( 900 dialect, 901 delimiter, (...) 908 dtype_backend=dtype_backend, 909 ) 910 kwds.update(kwds_defaults) --> 912 return _read(filepath_or_buffer, kwds) File ~/Library/r-miniconda-arm64/envs/sbloggel/lib/python3.11/site-packages/pandas/io/parsers/readers.py:577, in _read(filepath_or_buffer, kwds) 574 _validate_names(kwds.get("names", None)) 576 # Create the parser. --> 577 parser = TextFileReader(filepath_or_buffer, **kwds) 579 if chunksize or iterator: 580 return parser File ~/Library/r-miniconda-arm64/envs/sbloggel/lib/python3.11/site-packages/pandas/io/parsers/readers.py:1407, in TextFileReader.__init__(self, f, engine, **kwds) 1404 self.options["has_index_names"] = kwds["has_index_names"] 1406 self.handles: IOHandles | None = None -> 1407 self._engine = self._make_engine(f, self.engine) File ~/Library/r-miniconda-arm64/envs/sbloggel/lib/python3.11/site-packages/pandas/io/parsers/readers.py:1661, in TextFileReader._make_engine(self, f, engine) 1659 if "b" not in mode: 1660 mode += "b" -> 1661 self.handles = get_handle( 1662 f, 1663 mode, 1664 encoding=self.options.get("encoding", None), 1665 compression=self.options.get("compression", None), 1666 memory_map=self.options.get("memory_map", False), 1667 is_text=is_text, 1668 errors=self.options.get("encoding_errors", "strict"), 1669 storage_options=self.options.get("storage_options", None), 1670 ) 1671 assert self.handles is not None 1672 f = self.handles.handle File ~/Library/r-miniconda-arm64/envs/sbloggel/lib/python3.11/site-packages/pandas/io/common.py:859, in get_handle(path_or_buf, mode, encoding, compression, memory_map, is_text, errors, storage_options) 854 elif isinstance(handle, str): 855 # Check whether the filename is to be opened in binary mode. 856 # Binary mode does not support 'encoding' and 'newline'. 857 if ioargs.encoding and "b" not in ioargs.mode: 858 # Encoding --> 859 handle = open( 860 handle, 861 ioargs.mode, 862 encoding=ioargs.encoding, 863 errors=errors, 864 newline="", 865 ) 866 else: 867 # Binary mode 868 handle = open(handle, ioargs.mode) FileNotFoundError: [Errno 2] No such file or directory: 'ParameterSets.csv'
def cml_model(y, t, Pz, Pyx, Pxy, TKI, Kz, Ky, Py, m, rz, a, d):
    X, Y, Z = y
    dX = Pyx * Y - Pxy * X
    dY = Pxy * X - Pyx * Y + Py * (1 - Y / Ky) * Y - m * Z * Y - d * TKI * Y
    dZ = rz + Z * Pz * (Y / (Kz ** 2 + Y ** 2)) - a * Z
    return (dX, dY, dZ)
ii = tuple(range(0, len(params_df) - 1))
ii = tuple(range(0, 9))
t = np.arange(0.0, 100, 0.01)
result_list = []

for i in ii:
    p, y0 = get_p_and_y0(params_df, i = i)
    result = odeint(cml_model,
                    dict_to_tuple(y0),
                    t,
                    args=dict_to_tuple(p))
    df = pd.DataFrame(result, columns = ['X', 'Y', 'Z'])
    df = df.assign(t = t)
    df['PatID'] = i
    result_list.append(df)

result = pd.concat(result_list, ignore_index=True)
result['PatID'] = result['PatID'].astype('category')
result_long = pd.melt(result,
id_vars = ['t', 'PatID'],
value_vars = ['X', 'Y', 'Z'],
value_name = 'cell_count')
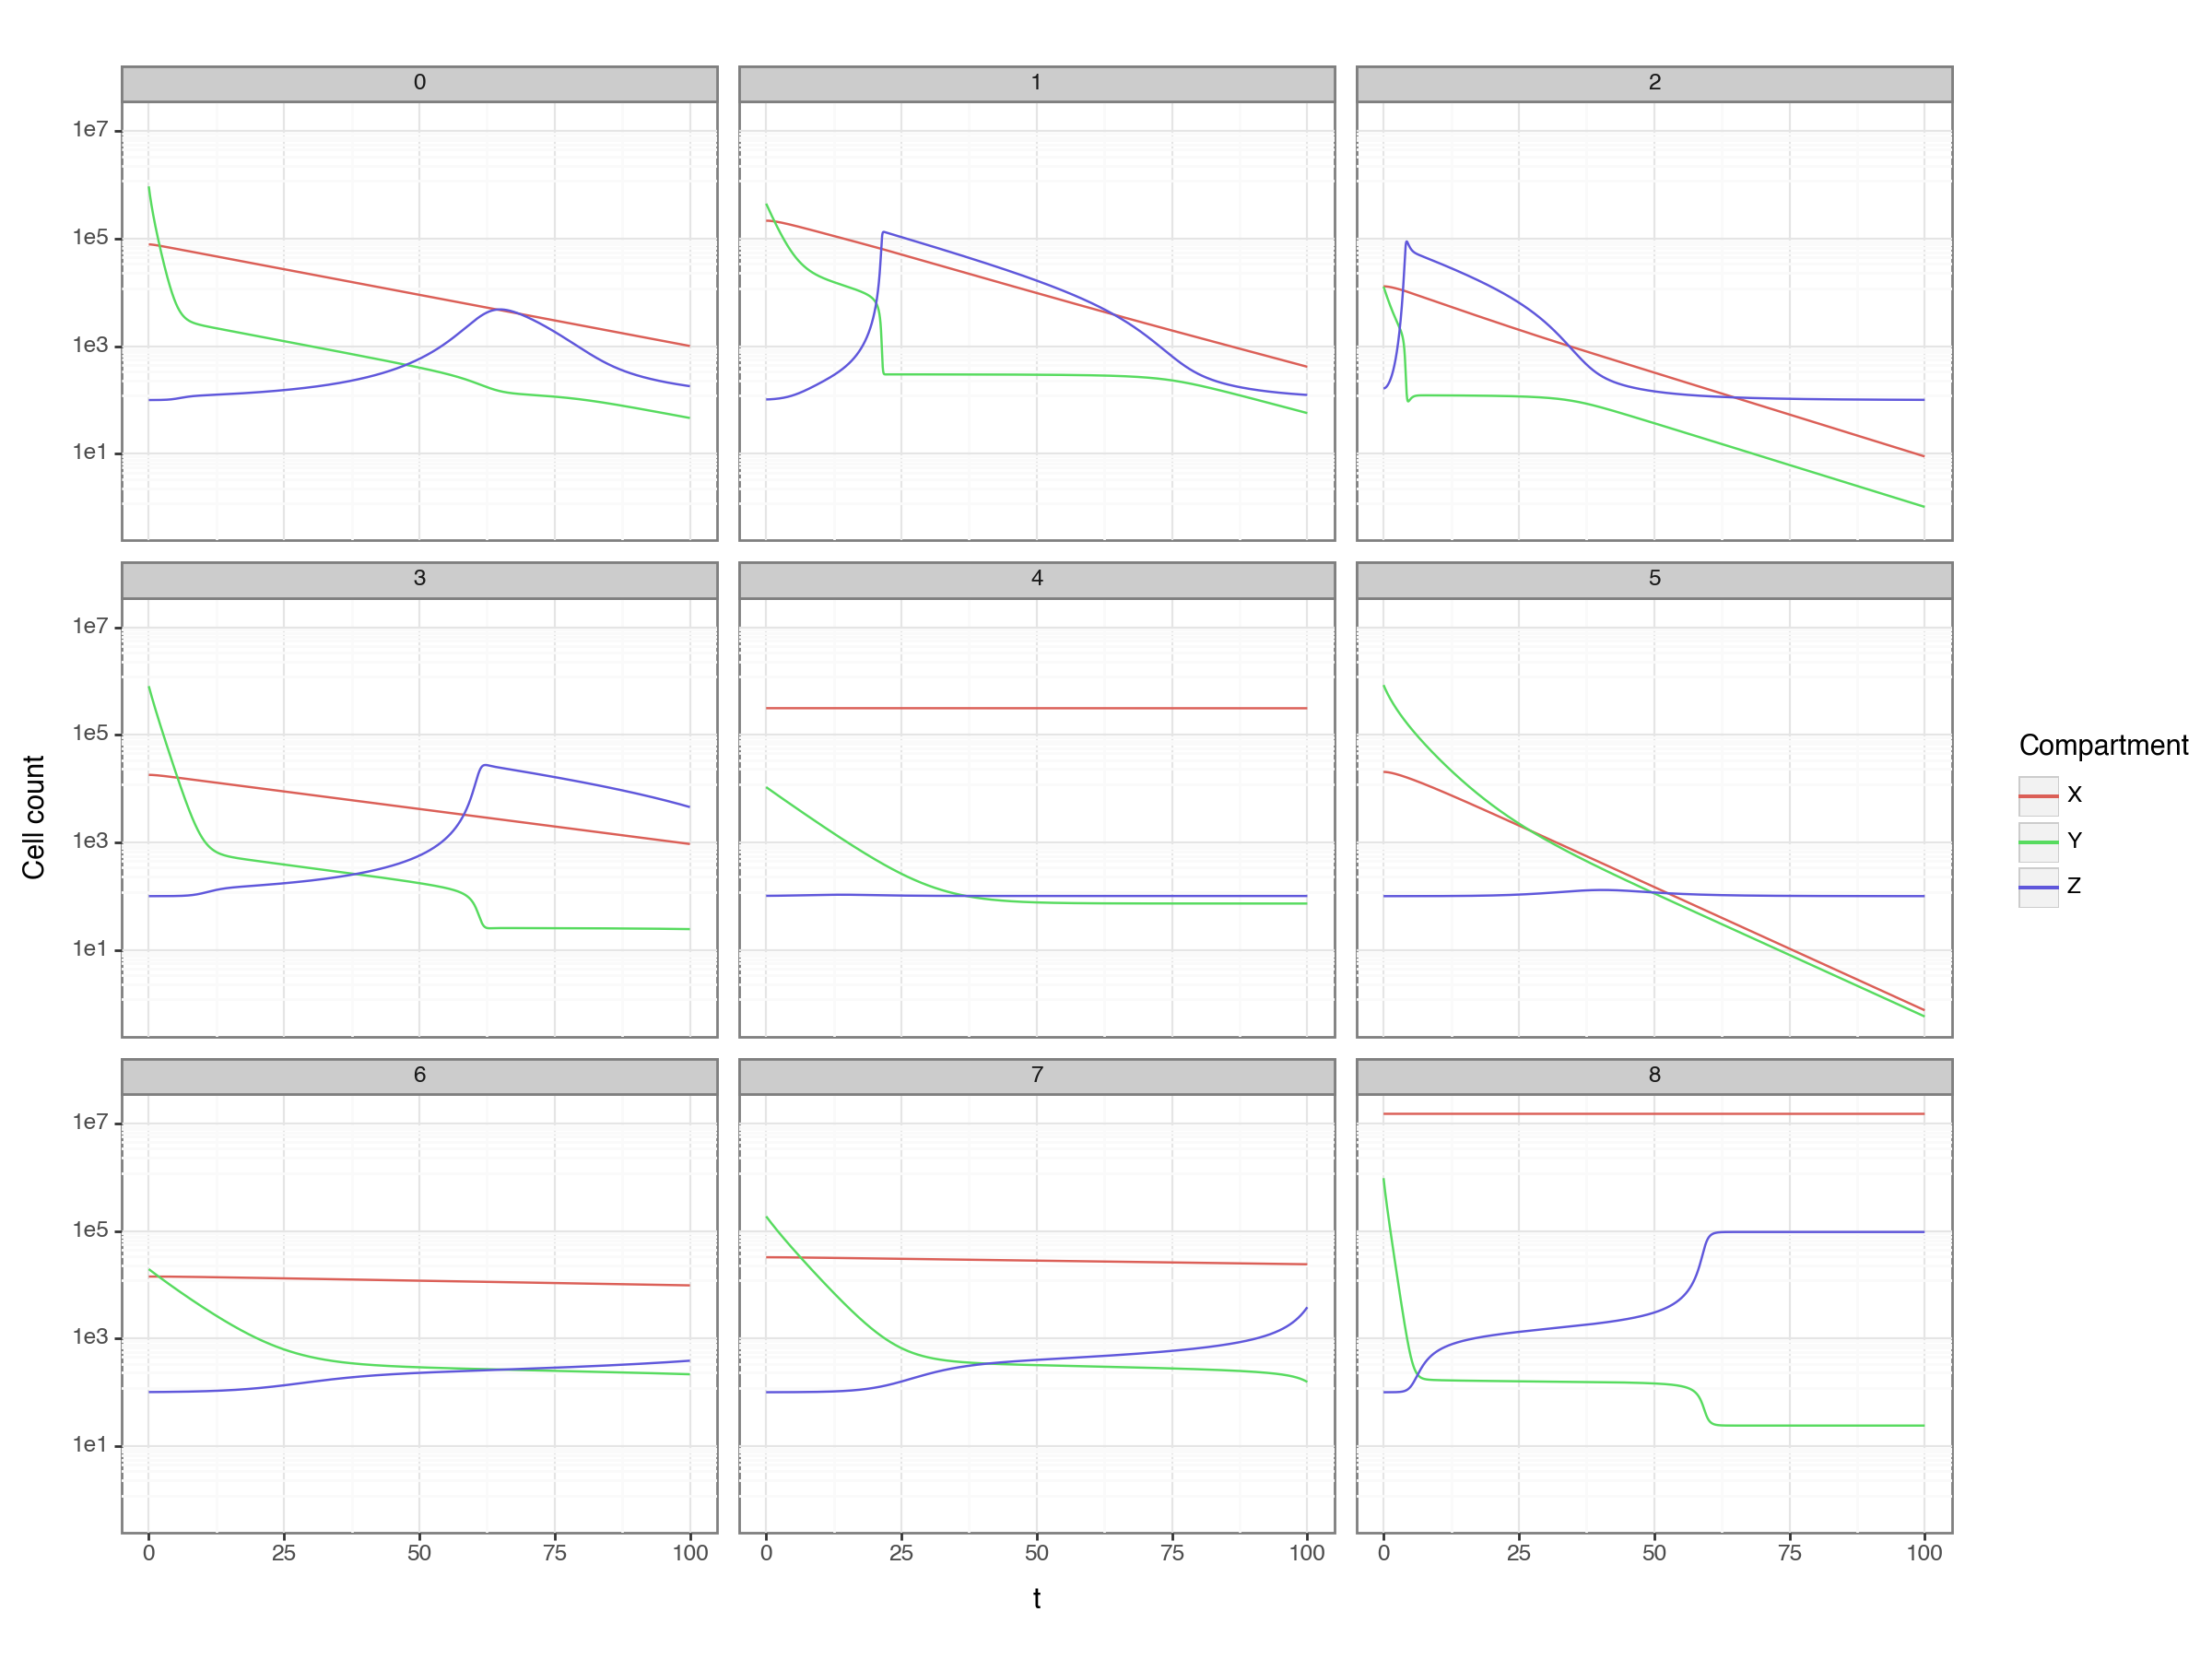
(
ggplot(result_long, aes('t', 'cell_count', color = 'variable')) +
geom_line() +
facet_wrap('PatID')+ p9.scale_y_continuous(trans='log10') +
p9.theme(figure_size=(12,9)) +
p9.labs(y='Cell count', color = 'Compartment')
)
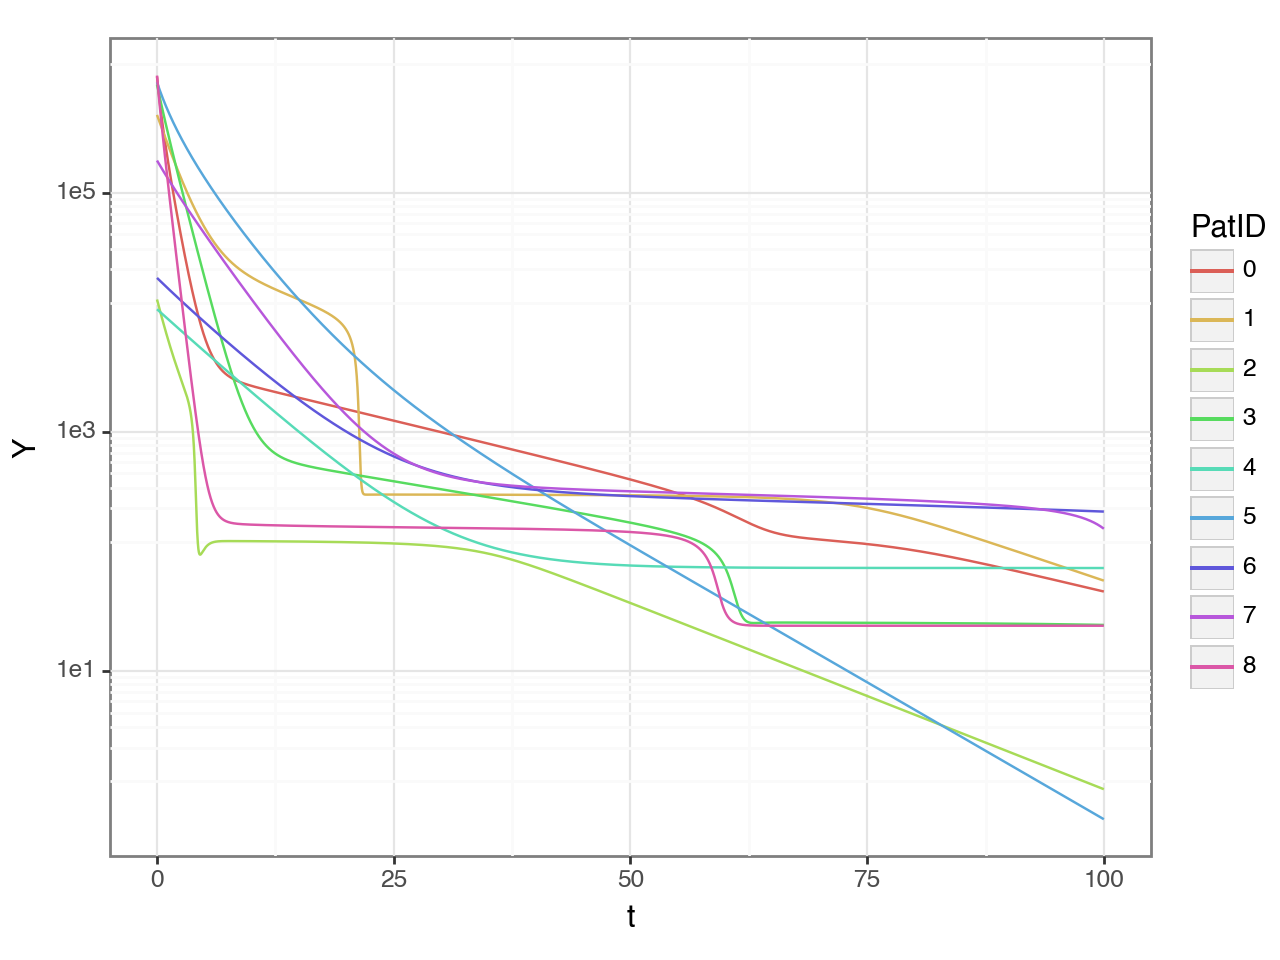
(
    ggplot(result, aes('t', 'Y', color = 'PatID')) +
    geom_line() + p9.scale_y_continuous(trans='log10')
)
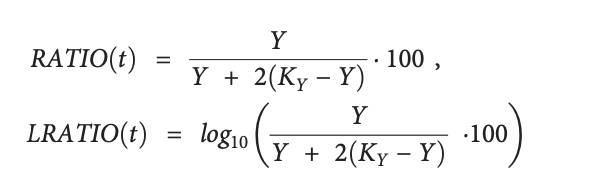
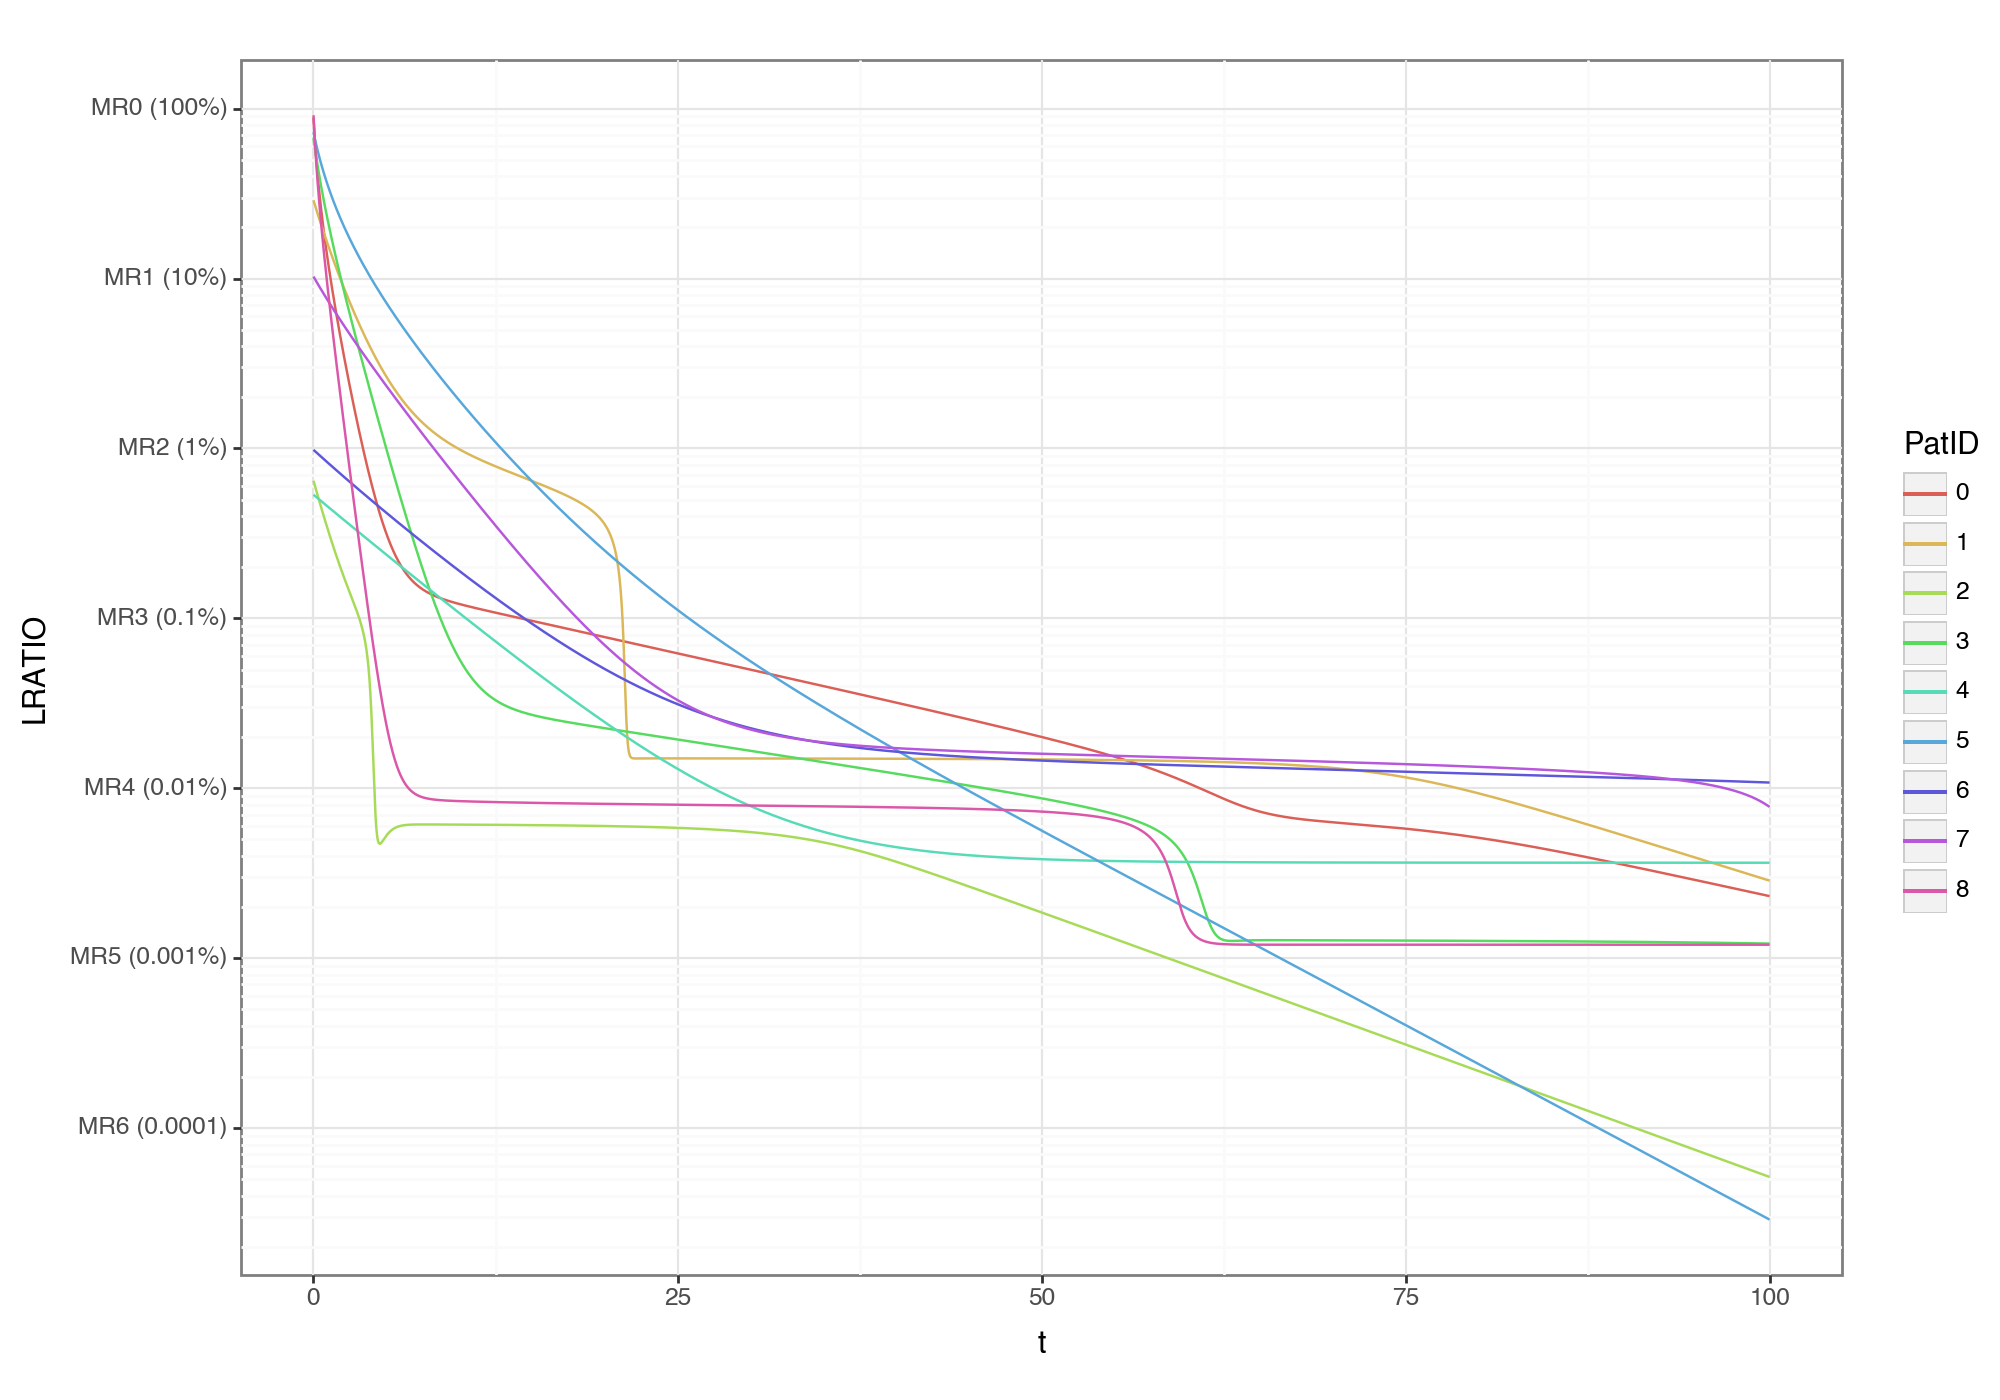
def LRATIO(Y, KY=1e6):
    return Y / (Y + 2 * (KY - Y))

result['LRATIO'] = LRATIO(result["Y"])

(
    ggplot(result, aes('t', 'LRATIO', color='PatID')) +
    geom_line() + p9.scale_y_continuous(trans='log10',
                                        breaks=(1, 1e-1, 1e-2, 1e-3, 1e-4, 1e-5, 1e-6),
                                        labels=('MR0 (100%)', 'MR1 (10%)', 'MR2 (1%)', 'MR3 (0.1%)', 'MR4 (0.01%)', 'MR5 (0.001%)', 'MR6 (0.0001)')) +
    p9.theme(figure_size=(10, 7))
)