# Change order of multiple guides:
ggplot(diamonds, aes(x = carat, y = price, color = cut, shape = clarity)) +
  geom_point() +
  labs(color = "Quality", shape = "Clarity Grade") +
  guides(shape = guide_legend(order = 2),
         color = guide_legend(order = 1))
Warning: Using shapes for an ordinal variable is not advisedWarning: The shape palette can deal with a maximum of 6 discrete values because more
than 6 becomes difficult to discriminate
ℹ you have requested 8 values. Consider specifying shapes manually if you need
that many have them.Warning: Removed 5445 rows containing missing values (`geom_point()`).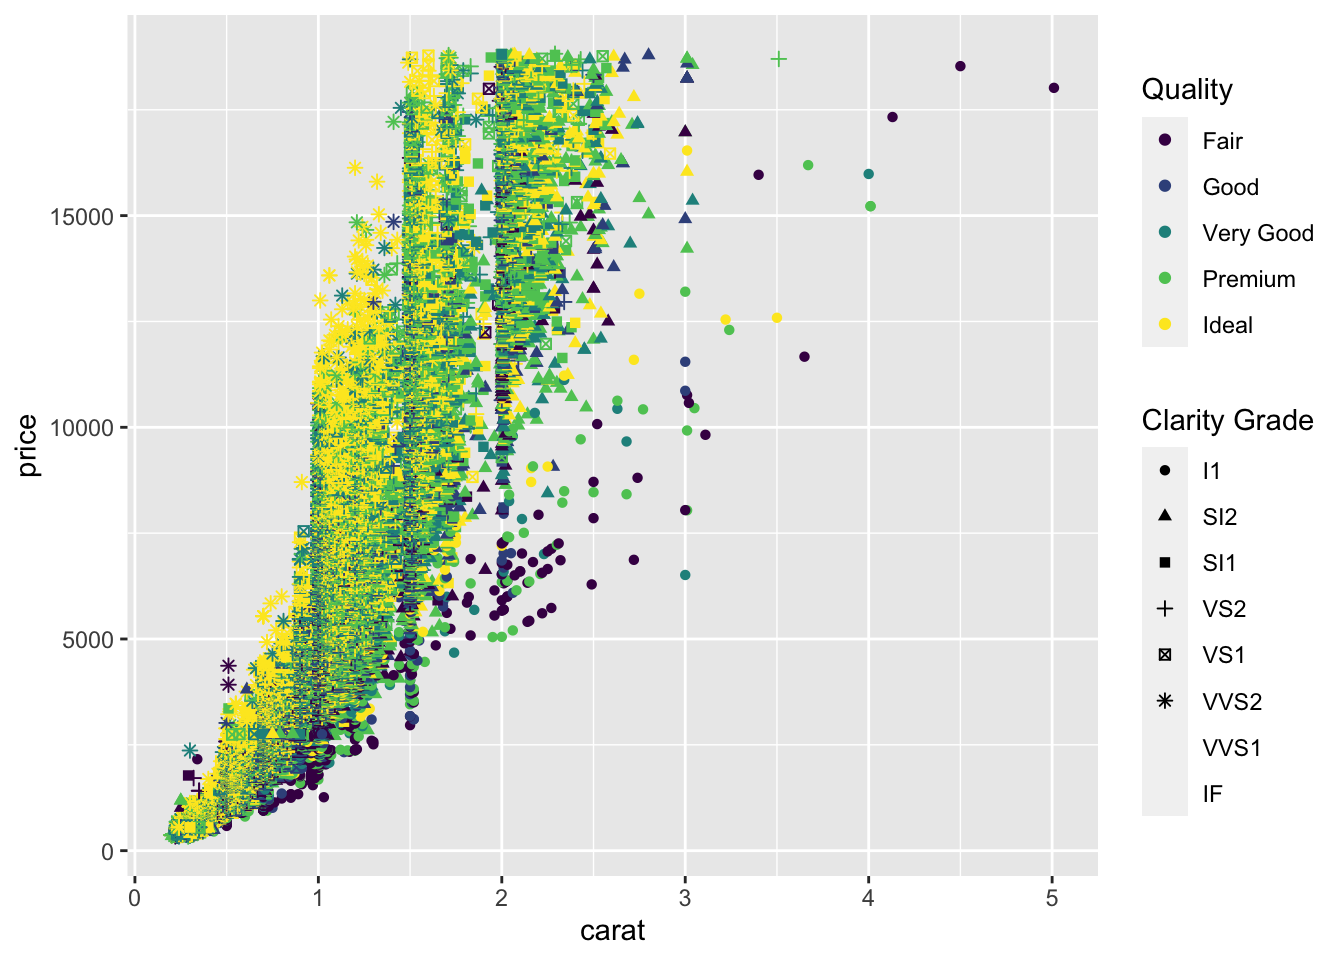
# Remove a legend:
ggplot(mtcars, aes(x = disp, y = mpg, color=factor(gear))) +
  geom_point()+
  theme(legend.position = "none")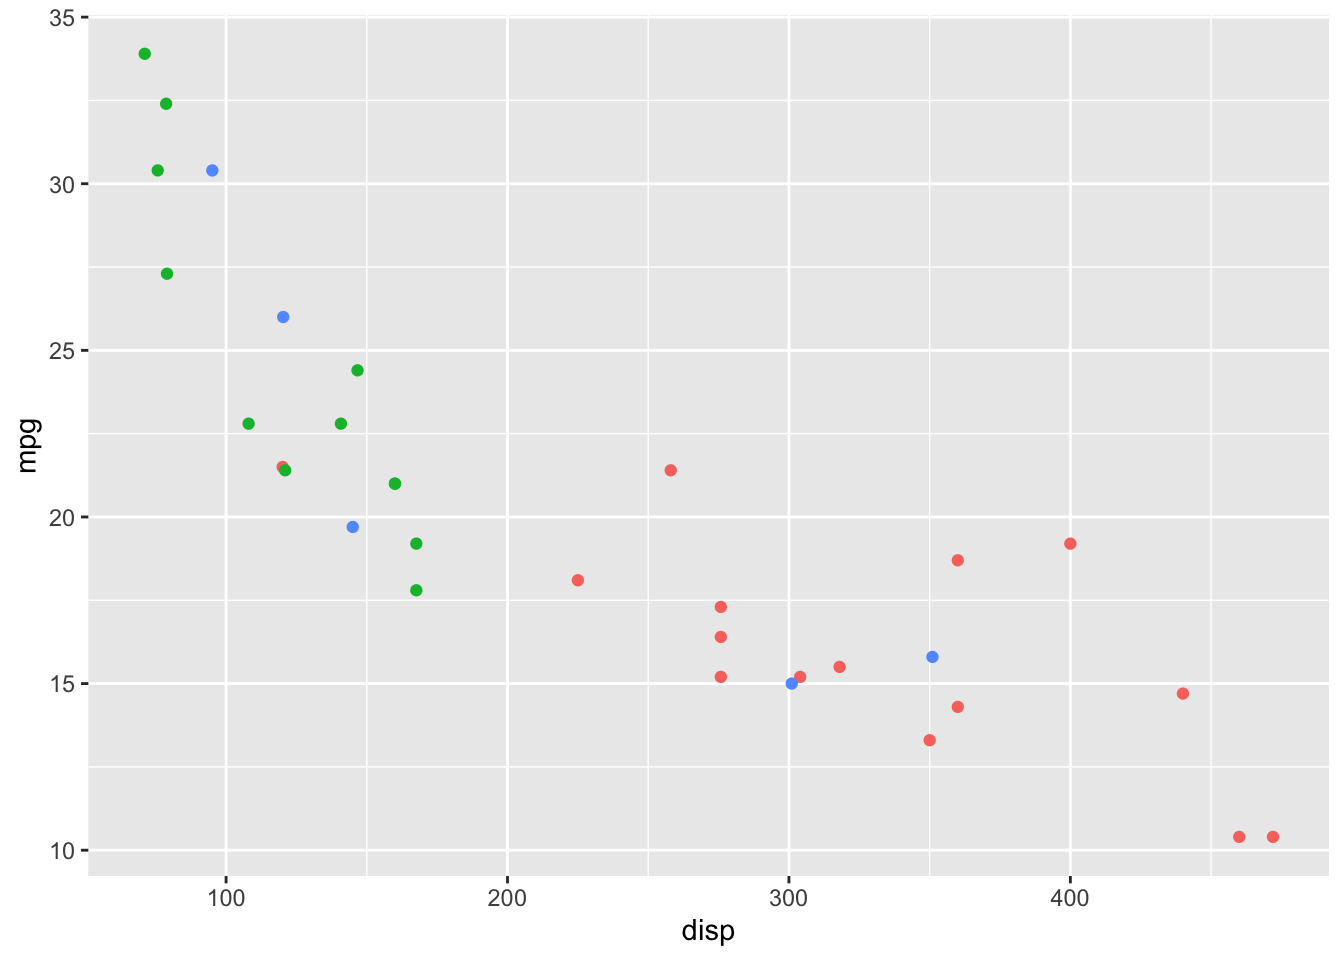
# Removing the Legend for a Specific Aesthetic
ggplot(mtcars, aes(x = disp, y = mpg, color = factor(am), shape = factor(cyl))) +
  geom_point() +
  guides(shape = "none") # Target the shape legend for removal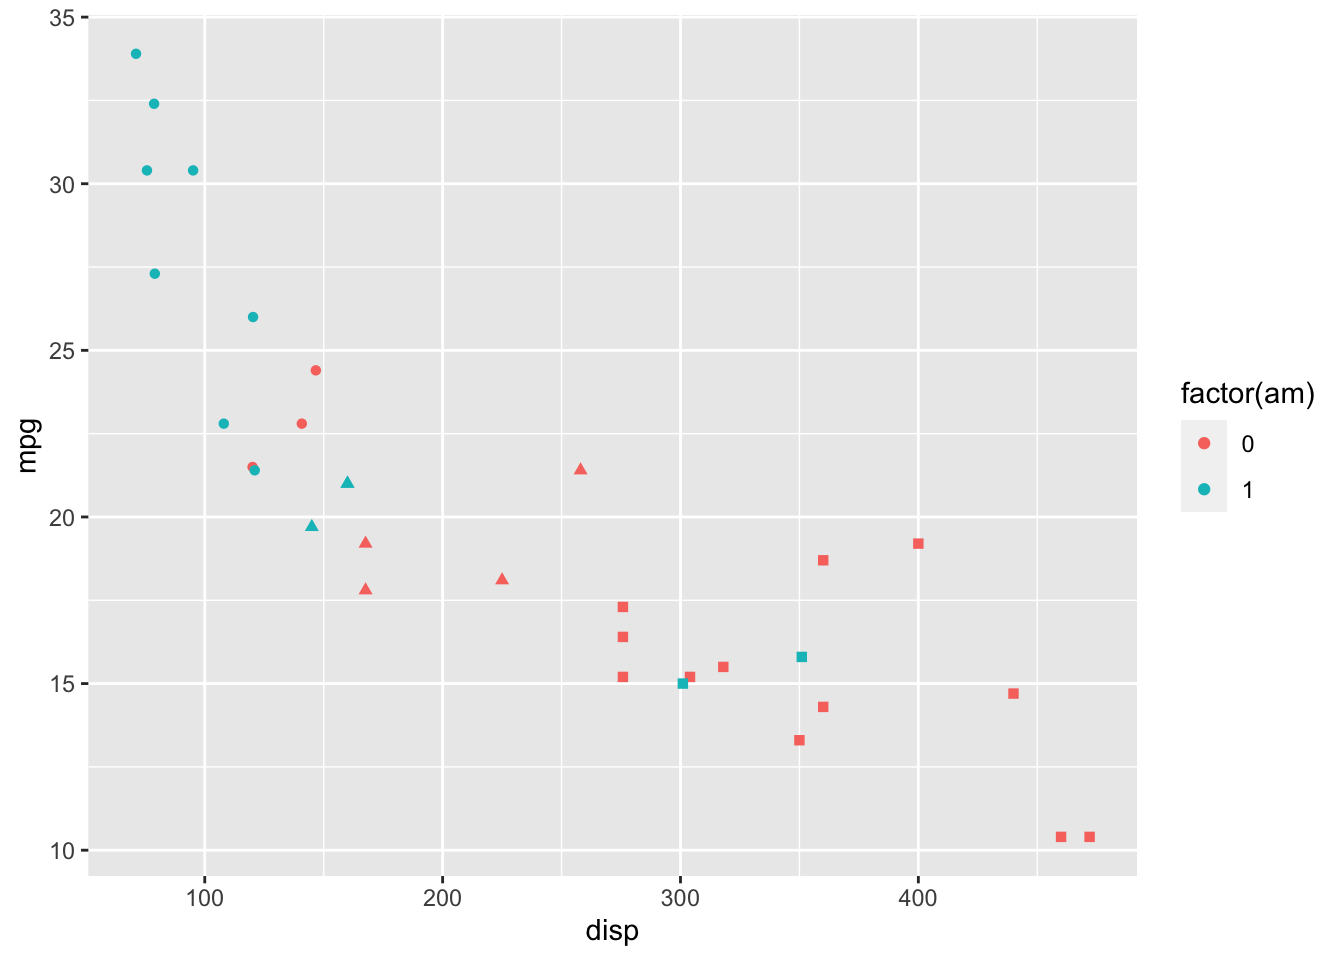
# Change legend position:
ggplot(diamonds, aes(x = carat, y = price, color = cut)) +
  geom_point() +
  theme(legend.position = "right") # Legend on the right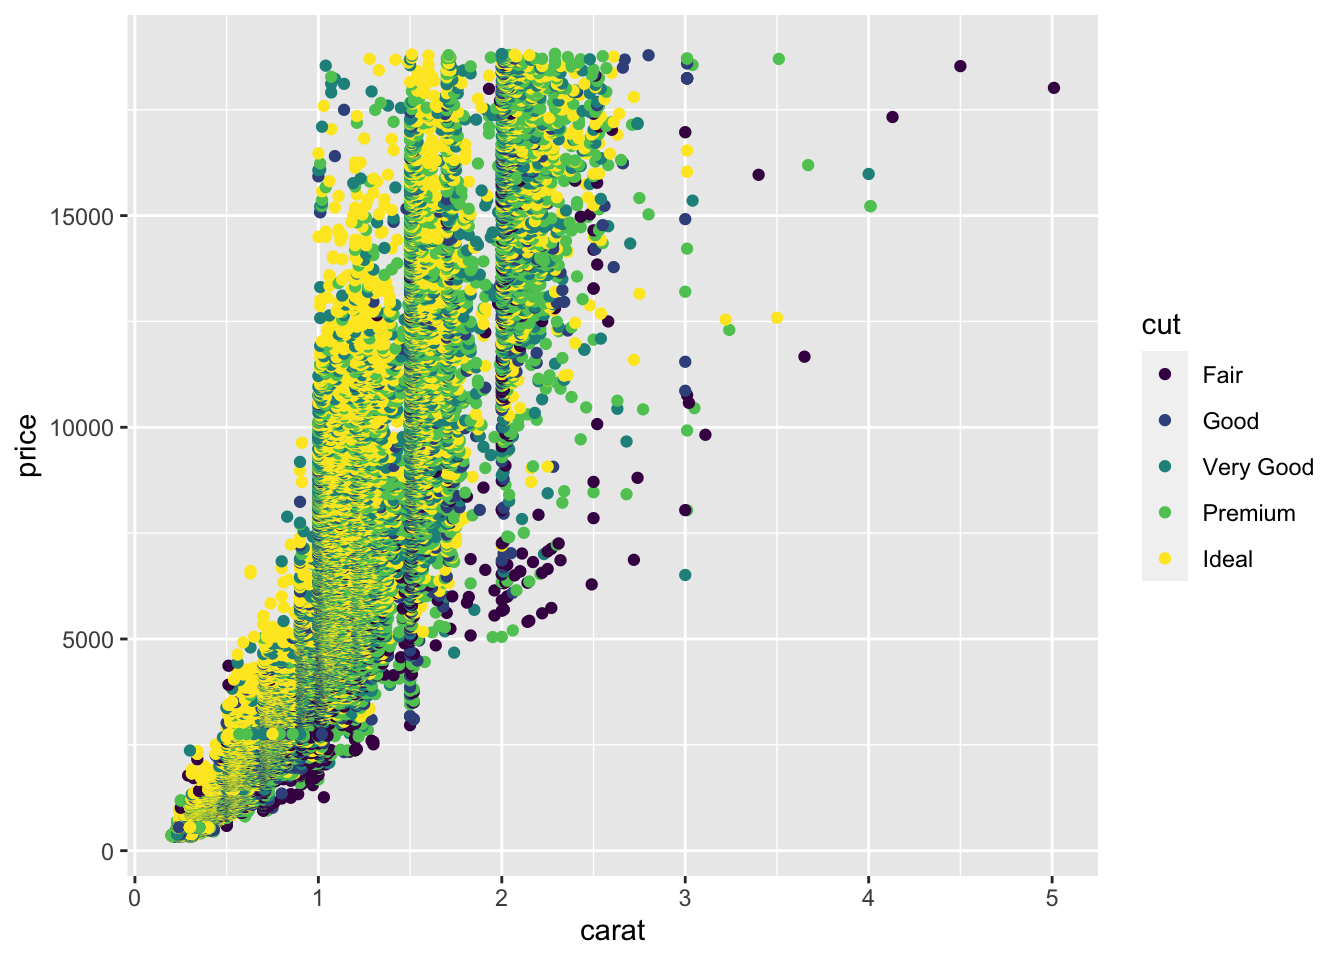
ggplot(diamonds, aes(x = carat, y = price, color = cut)) +
  geom_point() +
  theme(legend.position = c(0.9, 0.2)) # Custom coordinates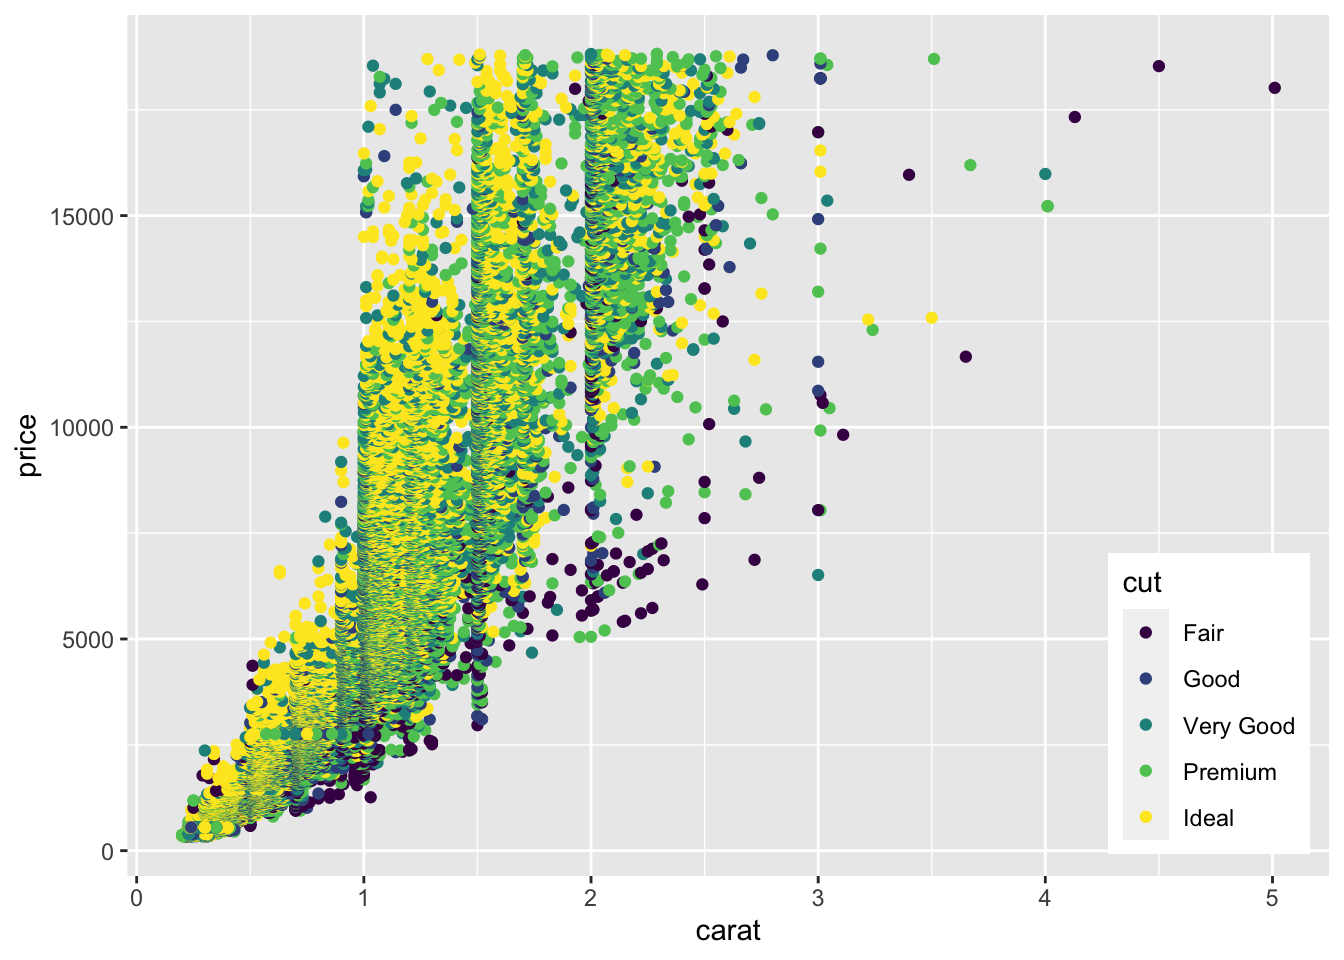
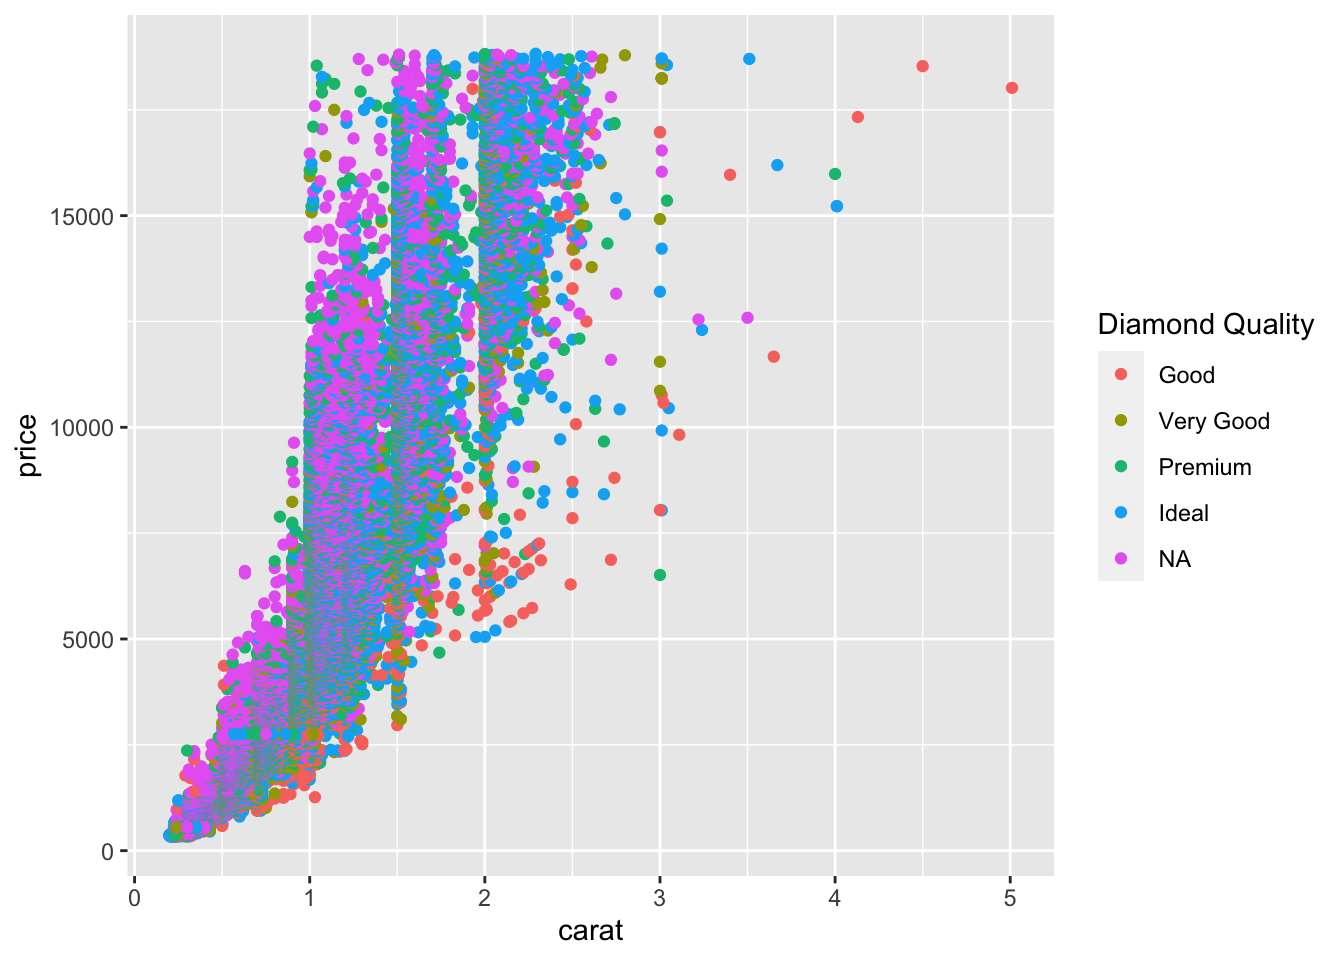
# Modifying Legend Title and Text
ggplot(diamonds, aes(x = carat, y = price, color = cut)) +
  geom_point() +
  labs(color = "Diamond Quality") + # Change title
  scale_color_discrete(labels = c("Good", "Very Good", "Premium", "Ideal")) # Update labels