nr_of_trials <- 100
calc_p <- Vectorize(
function(effect_size, n) {
y1 <- rnorm(n)
y2 <- rnorm(n, effect_size)
t.test(y1, y2)$p.value
}
)
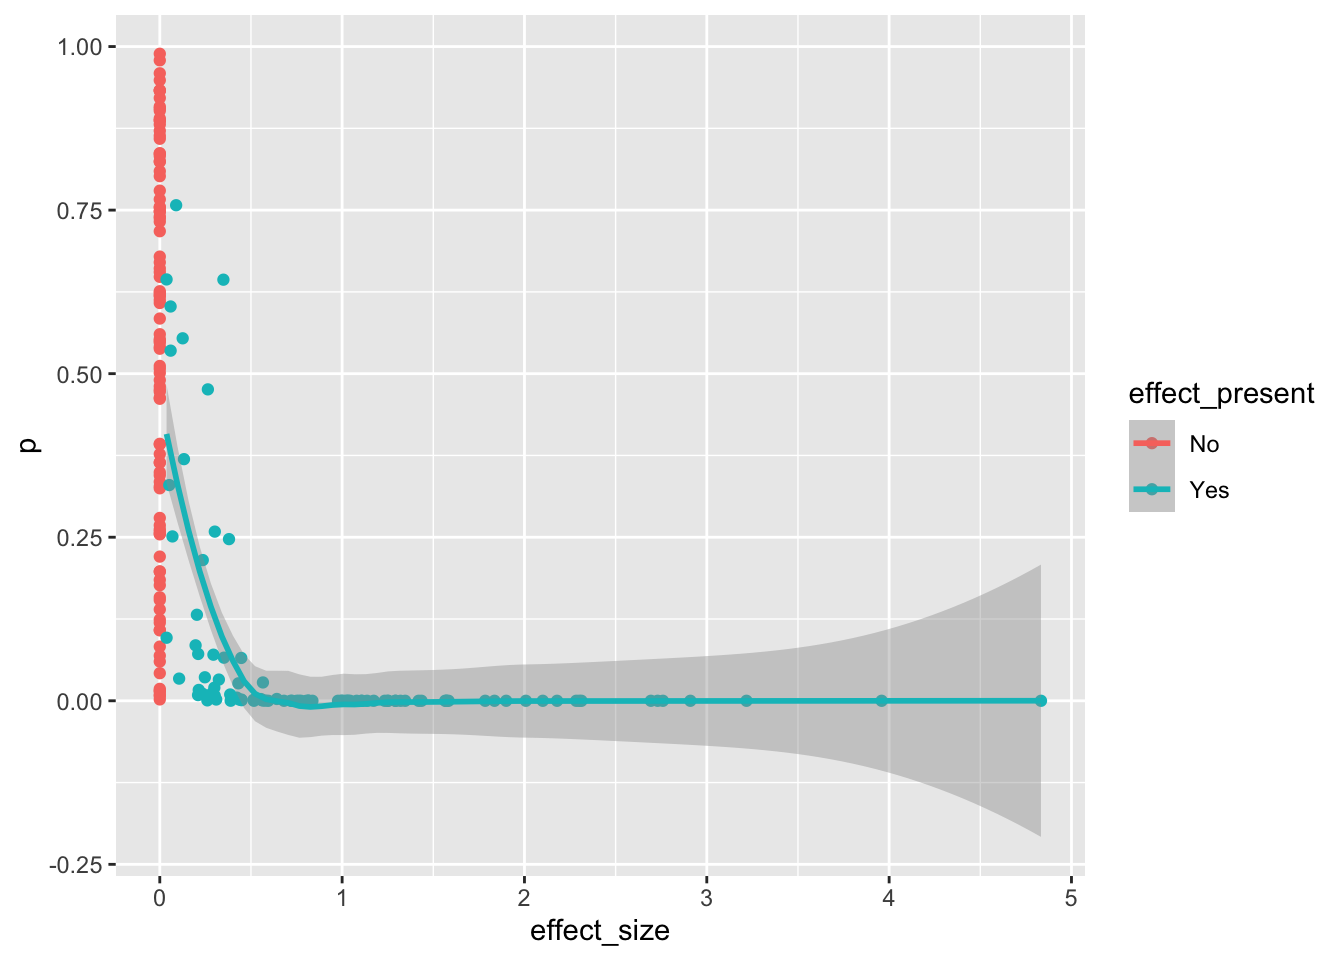
calc_p(1, 10)[1] 0.01657786dat <- tibble(effect_size = c(rep(0, nr_of_trials), rexp(nr_of_trials)),
effect_present = rep(c('No', 'Yes'), each = nr_of_trials),
n = 10,
p = calc_p(effect_size, nr_of_trials))
plot(sort(dat$p))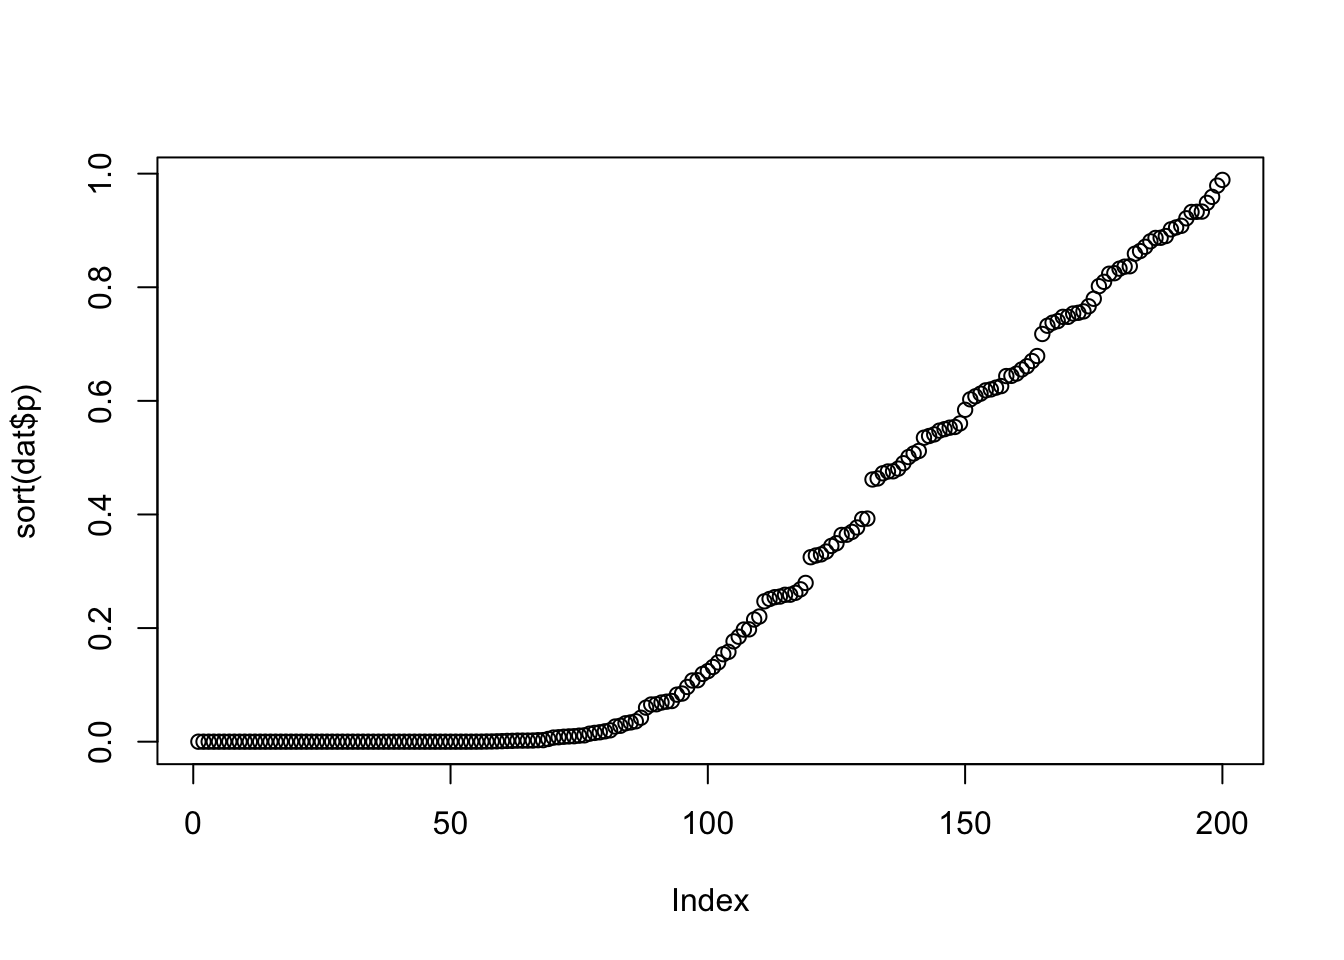
dat |>
  ggplot(aes(effect_size, p, colour = effect_present)) +
  geom_point() +
  geom_smooth()
`geom_smooth()` using method = 'loess' and formula = 'y ~ x'