import sys

def get_env():
    sp = sys.path[1].split("/")
    if "envs" in sp:
        return sp[sp.index("envs") + 1]
    else:
        return ""

get_env()'fast_ai_course_2022'import sys
def get_env():
sp = sys.path[1].split("/")
if "envs" in sp:
return sp[sp.index("envs") + 1]
else:
return ""
get_env()'fast_ai_course_2022'import numpy as np
import pandas as pd
import seaborn as sns
import matplotlib.pyplot as plt
from patsy import dmatrices, dmatrixn = 100
sd = 2
dat = pd.DataFrame()
dat["x1"] = np.random.normal(0, 5, n)
dat["x2"] = np.random.normal(0, 5, n)
dat["x3"] = np.random.choice(["A", "B"], size=n, replace=True)
dat["epsilon"] = np.random.normal(0, sd, n)
X = dmatrix(" ~ x1 + x2 + x3", dat)
X.design_info.column_names
beta = [14, 50, 1, -2]dat["y"] = np.matmul(X, beta) + dat["epsilon"]
dat| x1 | x2 | x3 | epsilon | y | |
|---|---|---|---|---|---|
| 0 | -7.579337 | -1.600375 | B | 1.394259 | 61.015673 |
| 1 | 1.827419 | 1.912467 | B | -2.066038 | 59.936446 |
| 2 | 0.916864 | 3.079072 | B | -2.647573 | 56.111148 |
| 3 | -8.580745 | 11.137583 | B | -0.409475 | 32.734615 |
| 4 | 11.100234 | 4.150596 | B | 0.588830 | 67.387871 |
| ... | ... | ... | ... | ... | ... |
| 95 | -5.862918 | -7.058553 | B | -1.026161 | 71.228028 |
| 96 | 3.791414 | 2.979757 | A | -2.858461 | 8.973439 |
| 97 | 4.200092 | 3.668948 | B | -1.505371 | 59.356825 |
| 98 | -0.381726 | -1.413223 | B | 2.492208 | 68.936928 |
| 99 | -6.374441 | -0.552026 | A | 3.637649 | 12.367261 |
100 rows × 5 columns
sns.scatterplot(data=dat, x="x1", y="y");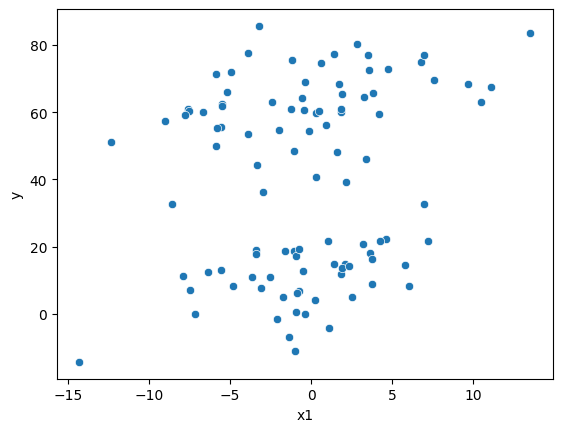
sns.scatterplot(data=dat, x="x2", y="y");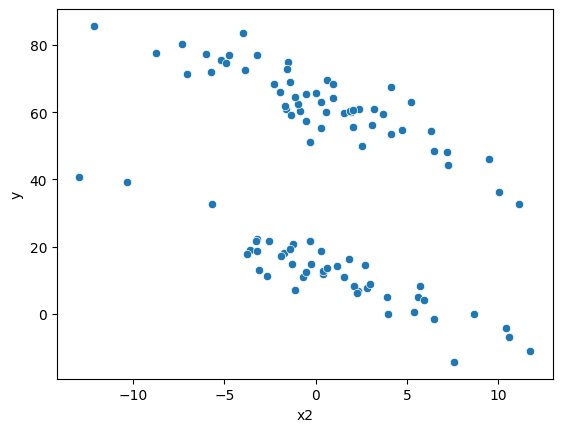
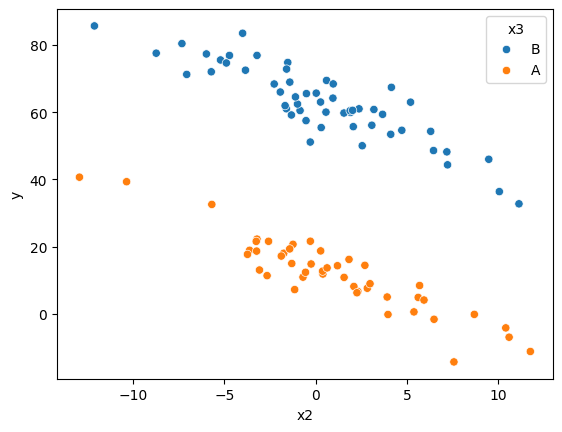
sns.scatterplot(data=dat, x="x2", y="y", hue="x3");