Python graphics

Published

July 5, 2023

Init

import pandas as pd
import matplotlib.pyplot as plt
import seaborn as sns
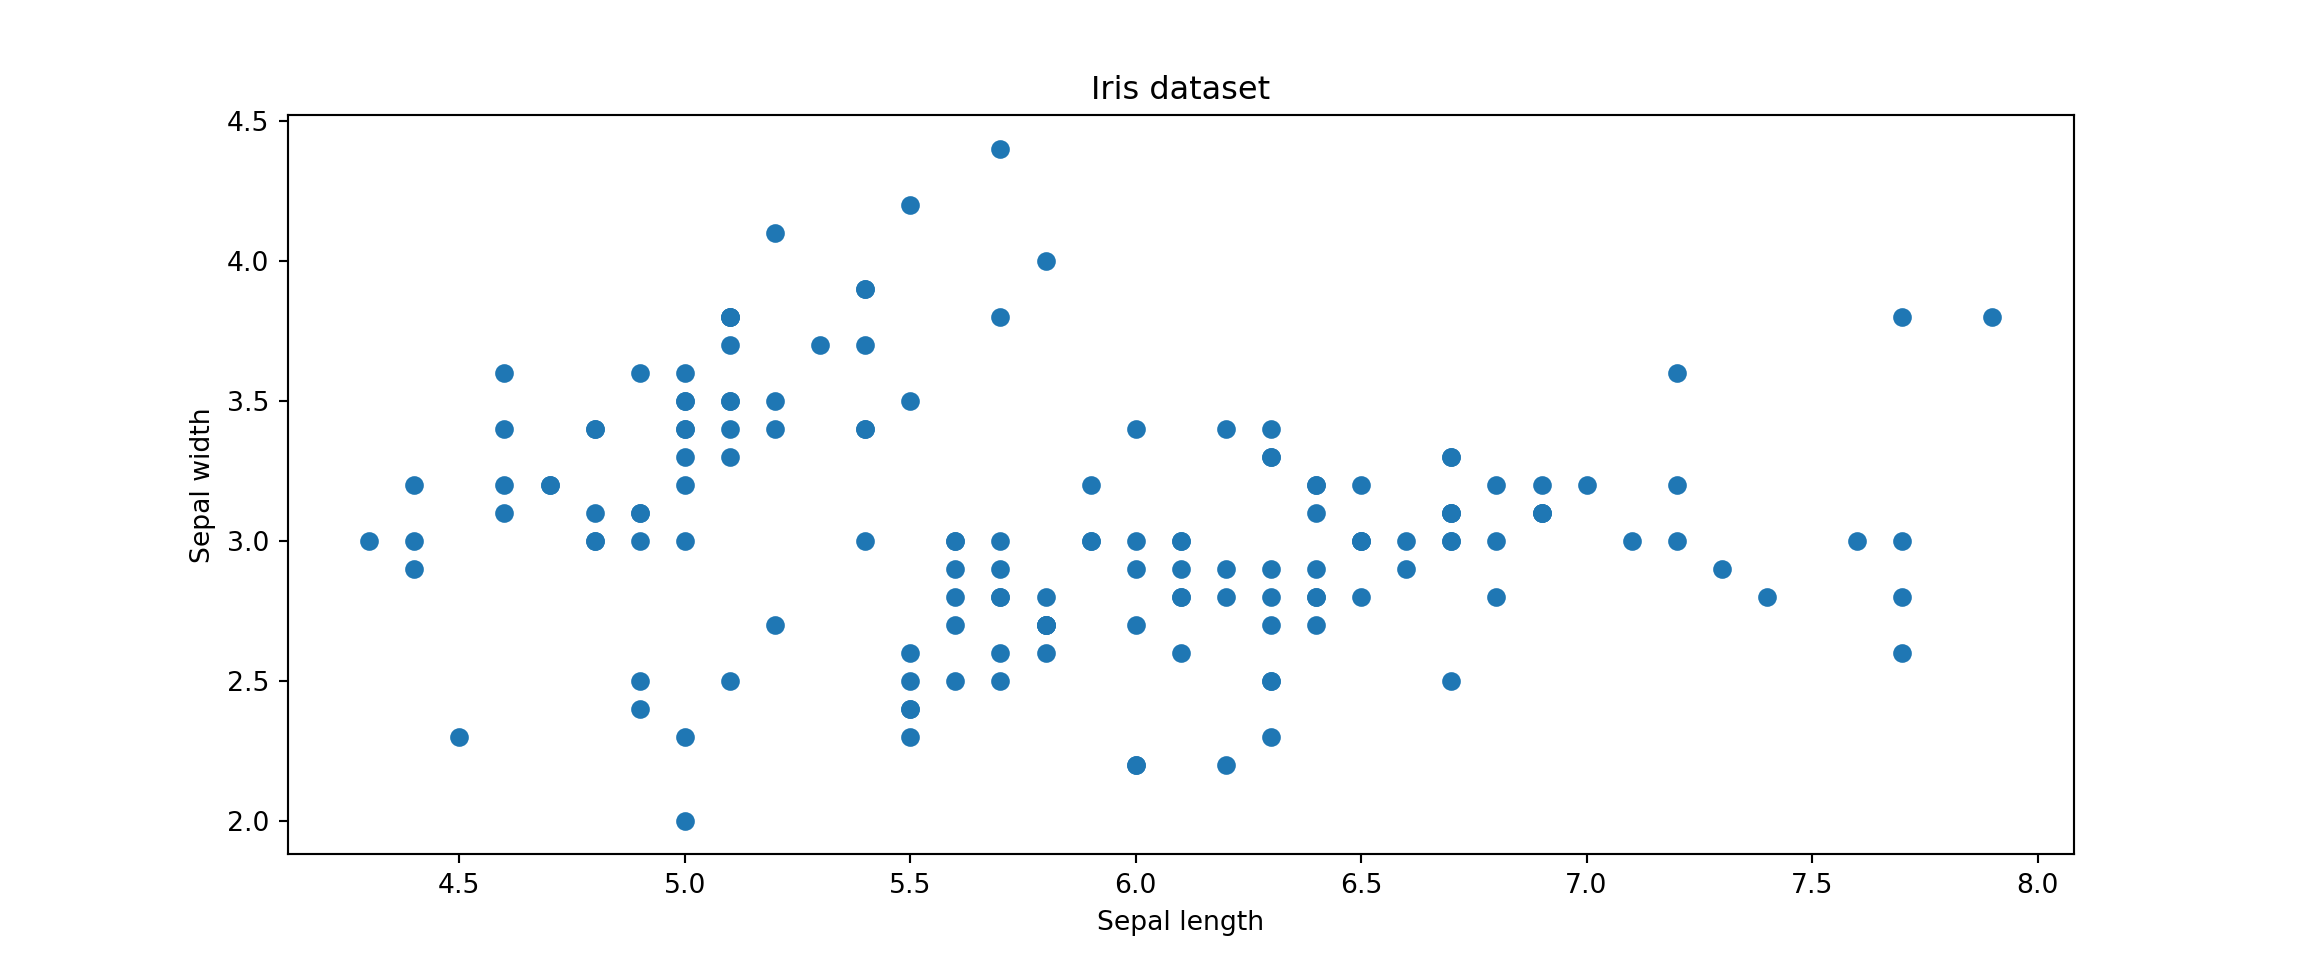
sns.get_dataset_names()
['anagrams', 'anscombe', 'attention', 'brain_networks', 'car_crashes', 'diamonds', 'dots', 'dowjones', 'exercise', 'flights', 'fmri', 'geyser', 'glue', 'healthexp', 'iris', 'mpg', 'penguins', 'planets', 'seaice', 'taxis', 'tips', 'titanic']
iris = sns.load_dataset('iris')

Setting figure sizes

Matplotlib

plt.rcParams['figure.figsize'] = [12, 5]
fig, ax = plt.subplots()
ax.set_xlabel('Sepal length')
ax.set_ylabel('Sepal width')
ax.set_title('Iris dataset')
ax.scatter(iris['sepal_length'], iris['sepal_width'])
plt.show()

Seaborn

g = sns.FacetGrid(iris, col = 'species', col_wrap = 1, height = 2, aspect = 2)
g = g.map(plt.scatter, 'sepal_length', 'sepal_width')
/Users/seb/Library/r-miniconda-arm64/envs/sbloggel/lib/python3.11/site-packages/seaborn/axisgrid.py:118: UserWarning: The figure layout has changed to tight
  self._figure.tight_layout(*args, **kwargs)
plt.show()

plt.close()

Seaborn examples

plt.figure(figsize=(6,6))
g = sns.scatterplot(data = iris, 
                    x = 'sepal_length', 
                    y = 'petal_width', 
                    hue = 'species')
plt.show()

plt.close()

Plotly examples

  • Width and height seem to be controlled mainly by width and height arguments of px.scatter (or whatever other plotly function)
# x and y given as array_like objects
import plotly.express as px
fig = px.scatter(x=[0, 1, 2, 3, 4], y=[0, 1, 4, 9, 25], width = 800, height = 800)
fig.show()