library(ggplot2)
iris |> ggplot(aes(Sepal.Length, Sepal.Width, colour = Species)) +
  geom_point(size = 3) +
  scale_colour_manual(values = c('lightgray', 'blue', 'black'),
                      aesthetics = c('colour', 'fill'))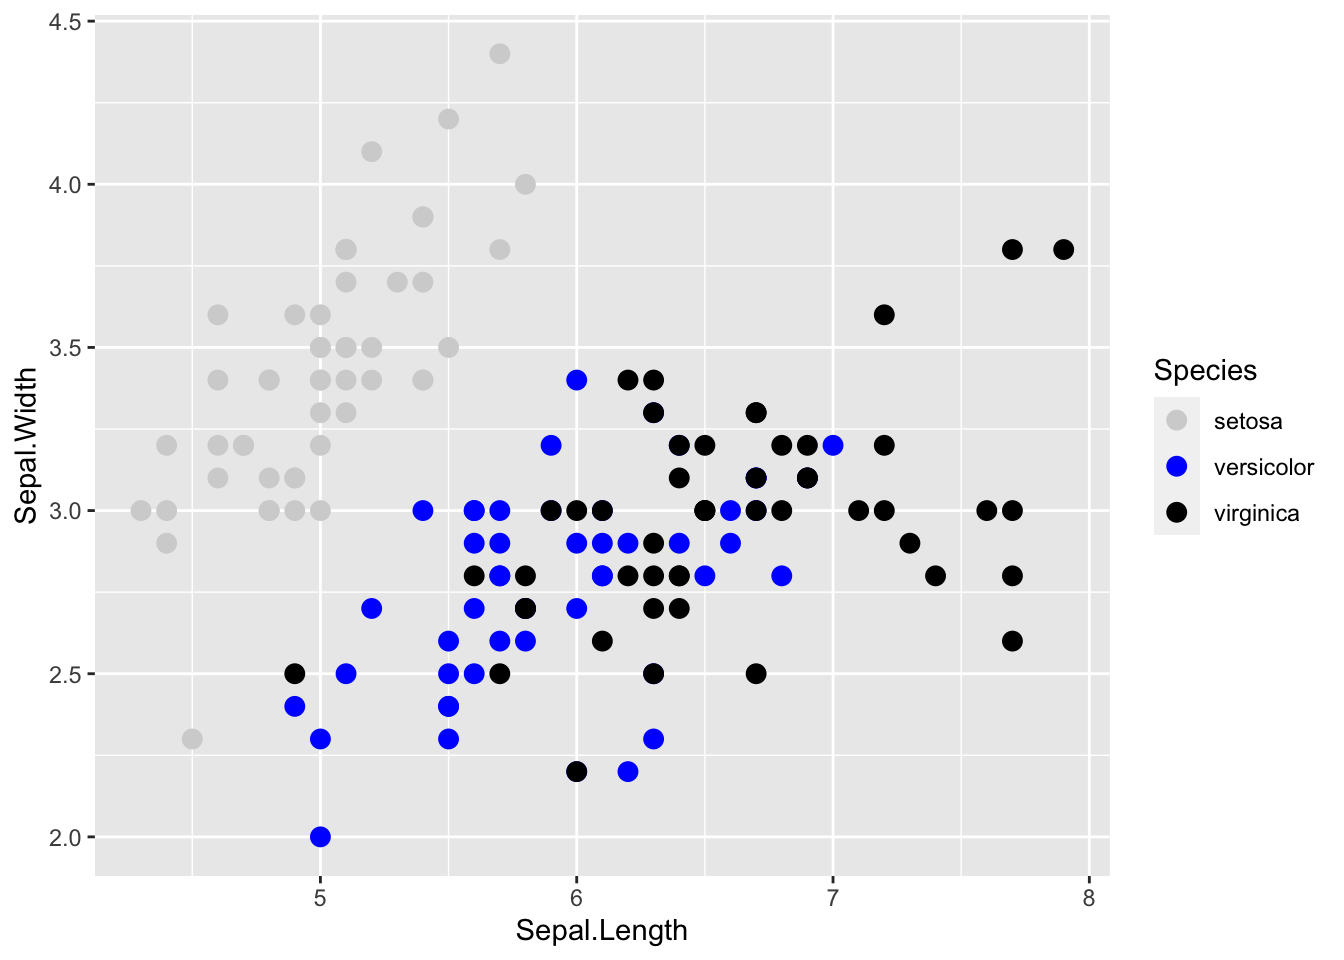
After several instances of “relearning” how to use custom colour palettes in R, I have written this post in order to save some time when I want to use custom colours the next time.
library(ggplot2)
iris |> ggplot(aes(Sepal.Length, Sepal.Width, colour = Species)) +
geom_point(size = 3) +
scale_colour_manual(values = c('lightgray', 'blue', 'black'),
aesthetics = c('colour', 'fill'))