library('ggplot2')
library('COVID19')
Retrieving and plotting COVID-19 data
R
Background
The COVID19 package allows to conveniently retrieve statistical data about the COVID-19 pandemy. Here, the data for Germany are retrieved and two exploratory plots are created.
Loading libraries
Retrieving the data
deu <- covid19('Germany', level = 1) We have invested a lot of time and effort in creating COVID-19 Data
Hub, please cite the following when using it:
Guidotti, E., Ardia, D., (2020), "COVID-19 Data Hub", Journal of Open
Source Software 5(51):2376, doi: 10.21105/joss.02376
The implementation details and the latest version of the data are
described in:
Guidotti, E., (2022), "A worldwide epidemiological database for
COVID-19 at fine-grained spatial resolution", Sci Data 9(1):112, doi:
10.1038/s41597-022-01245-1
To print citations in BibTeX format use:
> print(citation('COVID19'), bibtex=TRUE)
To hide this message use 'verbose = FALSE'.Plotting total number of confirmed cases
ggplot(data = deu, aes(date, confirmed)) + geom_point() +
  geom_smooth()  + scale_y_log10()
`geom_smooth()` using method = 'gam' and formula = 'y ~ s(x, bs = "cs")'Warning: Removed 12 rows containing non-finite values (`stat_smooth()`).Warning: Removed 12 rows containing missing values (`geom_point()`).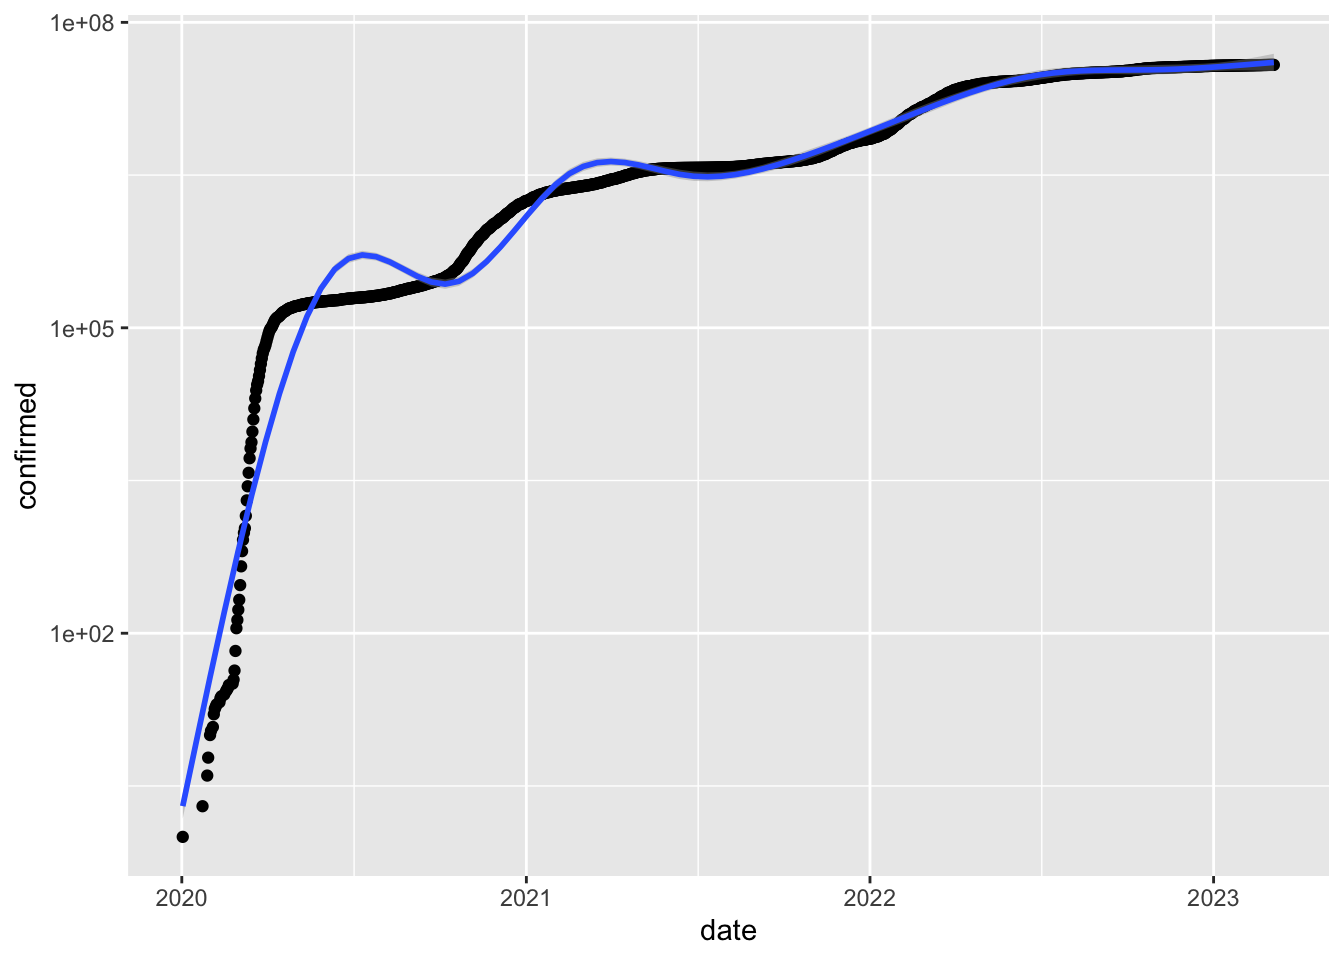
Plotting new cases
dat <- data.frame(date = deu$date[-1], new_cases = diff(deu$confirmed))
ggplot(data = dat, aes(date, new_cases)) + geom_point() +
  geom_smooth()  + scale_y_log10()
`geom_smooth()` using method = 'gam' and formula = 'y ~ s(x, bs = "cs")'Warning: Removed 19 rows containing non-finite values (`stat_smooth()`).Warning: Removed 19 rows containing missing values (`geom_point()`).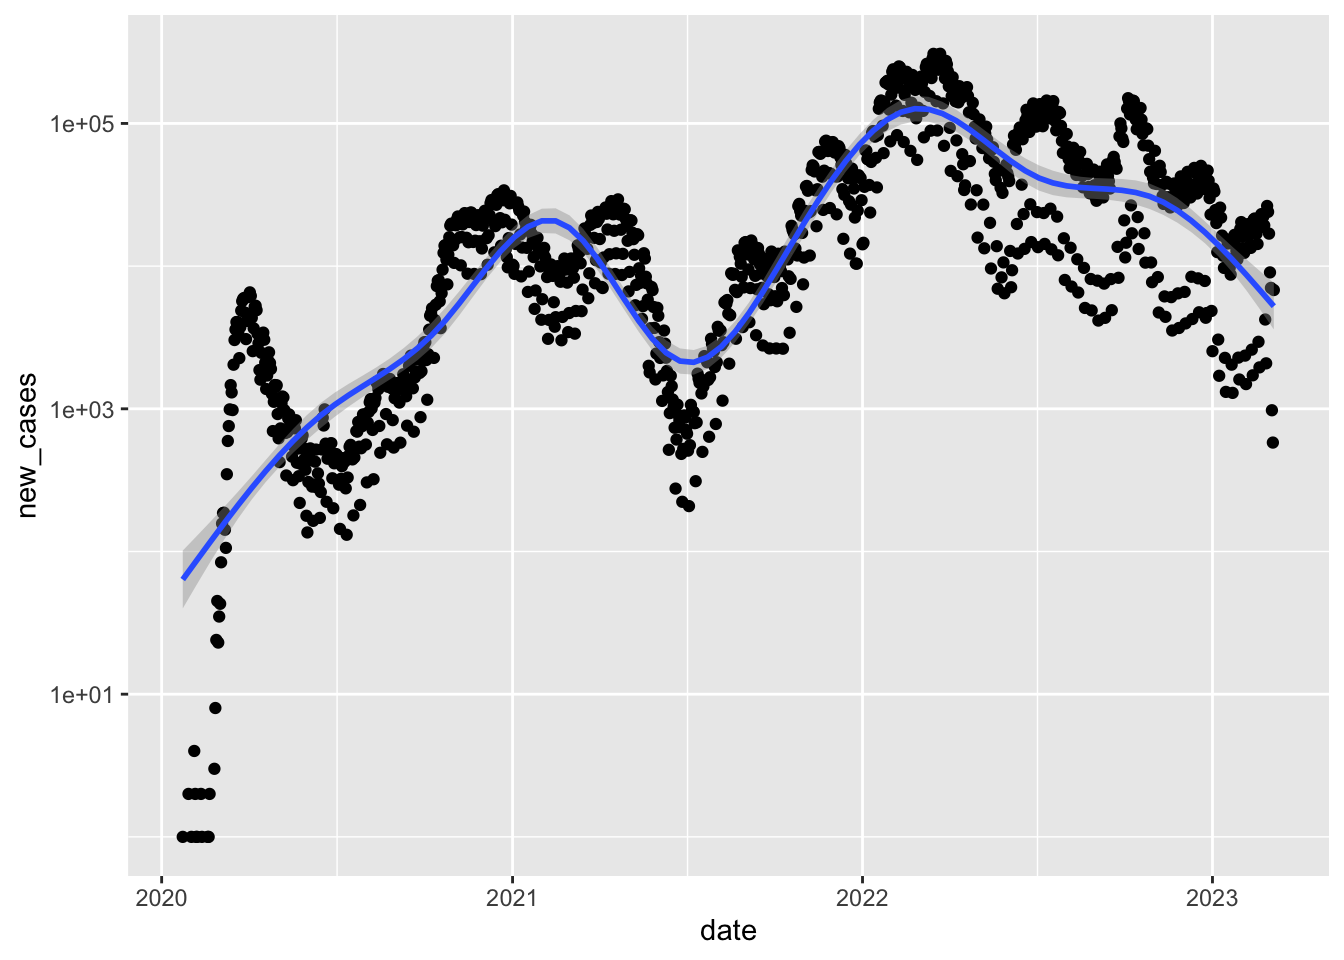
Conclusion
This package allows convenient retrieval of a lot of data about the COVID-19 pandemy.