library('tidyverse')
library(ggplot2)
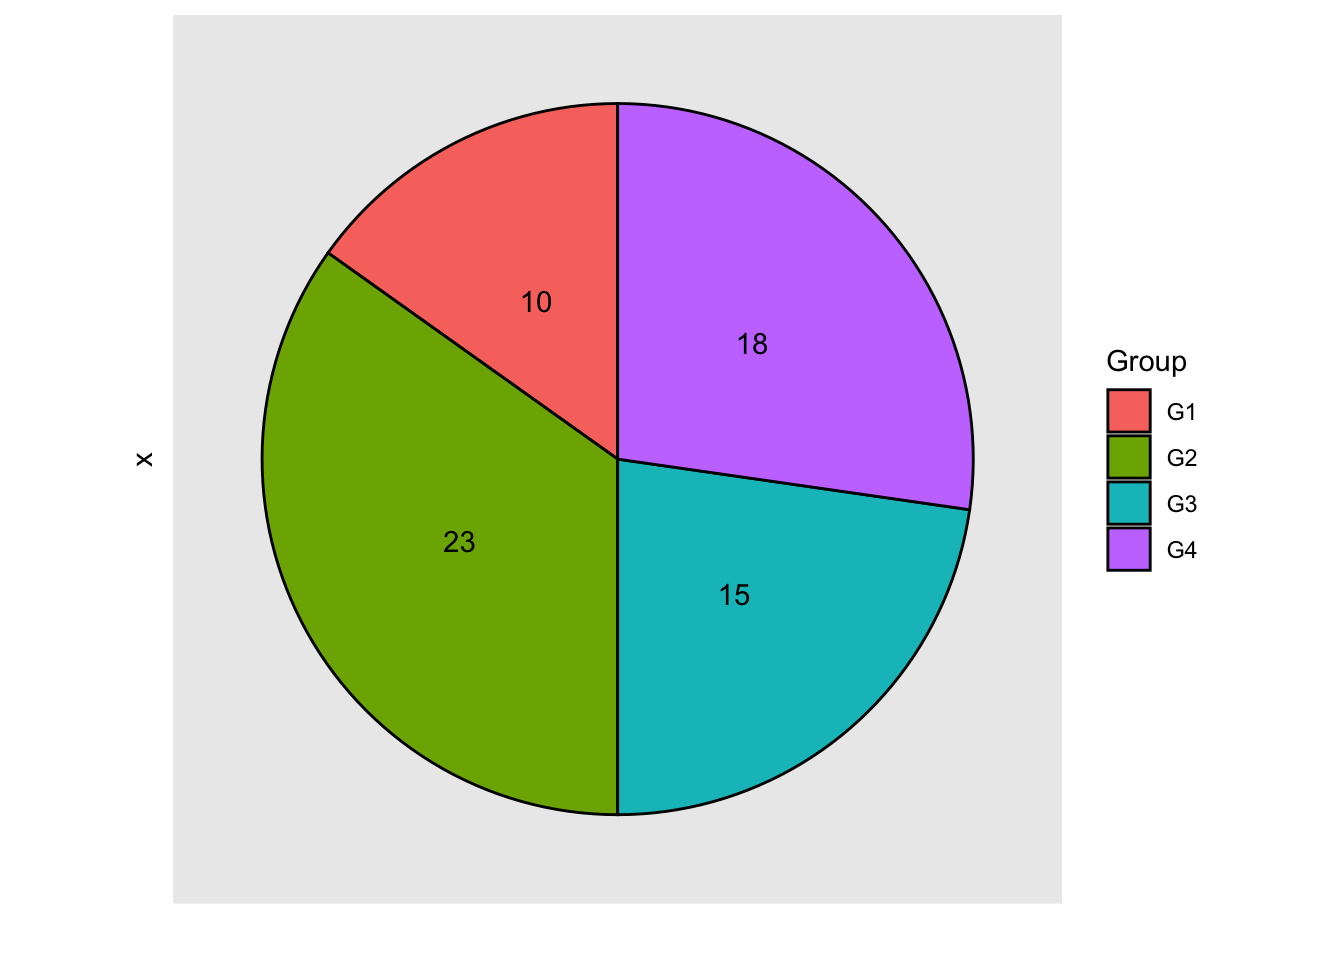
df <- data.frame(value = c(10, 23, 15, 18),
Group = paste0("G", 1:4))
ggplot(df, aes(x = "", y = value, fill = Group)) +
geom_col(color = "black") +
ylab('') +
geom_text(aes(label = value),
position = position_stack(vjust = 0.5)) +
coord_polar(theta = "y") +
theme(axis.text = element_blank(),
axis.ticks = element_blank(),
panel.grid = element_blank())